
This blog post will show you how to use Prometheus with your Norconex crawler. This process is possible thanks to Norconex crawlers offering useful metrics via JMX. Using this solution, you can conveniently track the advancement of a crawling task with a quick glance which is especially useful when you have several crawling jobs running simultaneously.
If you don’t already have Prometheus installed, we will also guide you through the installation process using Docker. Already have Prometheus installed? Go ahead and skip the first section.
The required setup consists of three main components: Prometheus, JMX agent, and Norconex web crawler.
StandUp a Prometheus Server
- Create a “prometheus-test” folder to store config files.
- Create a custom YAML file: premetheus_config.yaml and add the following:
global:
  scrape_interval: 15s
  evaluation_interval: 15s
  scrape_timeout: 10s

scrape_configs:
  # job_name: the name you give, usually one for each collector
  - job_name: 'collector-http'
    static_configs:
- targets: ['host.docker.internal:9123']- Create a Dockerfile in the same folder. In it, add the Prometheus image to be used, and then add the premetheus_config.yaml file created earlier.
FROM prom/prometheus
ADD prometheus_config.yaml /etc/prometheus/- Now it is time to build and start up the Prometheus container by running:
docker build -t my-prometheus-image .
docker run -dp 9090:9090 my-prometheus-image- Confirm the service is running:
docker ps- You should get something like this:

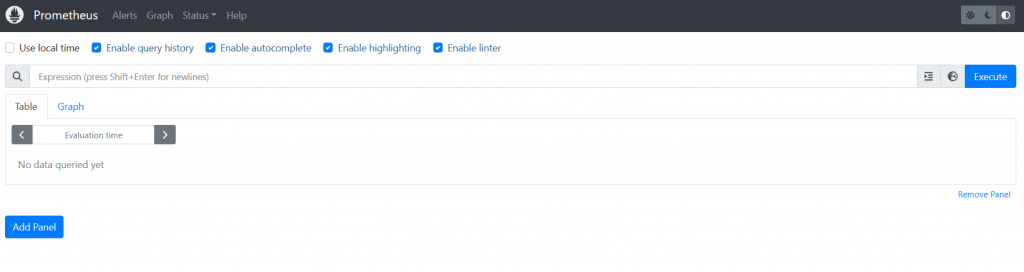
- Open your browser, and access Prometheus: http://localhost:9090
JMX Exporter / Prometheus Java Agent
Once Prometheus is up and running, you need to download the Prometheus JMX Java agent plugin. This agent reads information exposed by the crawler registered JMX mBeans and is intended to be run as a Java Virtual Machine (JVM) agent.
The latest plugin version will be used (version 0.18 as of this writing). Download the jar file, and save it in the prometheus-test folder. This agent requires Java 18. If you don’t already have it installed, download it here.
Next, you will create a jmx_config.yaml file to define the settings used by the JMX agent. Add the following to the file:
--- startDelaySeconds: 0

ssl: false
lowercaseOutputName: false
lowercaseOutputLabelNames: false
Norconex Web Crawler
Norconex has two types of crawlers: web and file-system. We will use the web version in our test, so go ahead and download the crawler if you haven’t already done so.
To start crawling, you need to define the start URL and other settings, which should be defined in the crawler-config.xml file. Let’s create one now.
In the “prometheus-test” folder, create an XML file called “crawler_config.xml”. Then add the following:
<?xml version="1.0" encoding="UTF-8"?>

<httpcollector id="prometheus-test-collector">

  <!-- Decide where to store generated files. -->
  <workDir>${workdir}</workDir>
  <deferredShutdownDuration>10 seconds</deferredShutdownDuration>

  <crawlers>
    <crawler id="prometheus-test-crawler">

      <!-- Requires at least one start URL (or urlsFile).
           Optionally limit crawling to same protocol/domain/port as
           start URLs. -->
      <startURLs stayOnDomain="true" stayOnPort="true" stayOnProtocol="false">
        <url>https://www.britannica.com</url>
      </startURLs>

      <!-- === Recommendations: ============================================ -->

      <!-- Put a maximum depth to avoid infinite crawling (e.g. calendars). -->
      <maxDepth>1</maxDepth>
	  <numThreads>${numThreads|'3'}</numThreads>
	  <maxDocuments>${maxDocuments|'1000'}</maxDocuments>
	  <canonicalLinkDetector ignore="true" />
	  <robotsTxt ignore="true" />
	  <robotsMeta ignore="true" />
	  <orphansStrategy>IGNORE</orphansStrategy>

      <!-- We know we don't want to crawl the entire site, so ignore sitemap. -->
      <sitemapResolver ignore="true" />

      <!-- Be as nice as you can to sites you crawl. -->
      <delay default="2 seconds" />

      <referenceFilters>
        <filter class="ReferenceFilter" onMatch="exclude">
	  <valueMatcher method="regex">.*literature.*</valueMatcher>
        </filter>
      </referenceFilters>

      <!-- Document importing -->
      <importer>
        <postParseHandlers>
          <!-- If your target repository does not support arbitrary fields,
               make sure you only keep the fields you need. -->
          <handler class="com.norconex.importer.handler.tagger.impl.KeepOnlyTagger">
            <fieldMatcher method="csv">title,document.reference</fieldMatcher>
          </handler>
        </postParseHandlers>
      </importer>

      <!-- Decide what to do with your files by specifying a Committer. -->
      <committers>
        <committer class="core3.fs.impl.XMLFileCommitter">
          <docsPerFile>250</docsPerFile>
	  <indent>4</indent>
	  <splitUpsertDelete>false</splitUpsertDelete>
        </committer>
      </committers>

    </crawler>
  </crawlers>

</httpcollector>
Start the Crawler
Initiating the crawling task and enabling Prometheus to fetch metrics from the crawler is a straightforward process. But to ensure reproducibility, create a batch file (make it an equivalent script file on Unix/Linux) that contains the necessary command. This way, you can effortlessly launch the crawler whenever required.
In the “prometheus-test” folder, create a run-job.bat file. Then add the following:
@echo off

set CRAWLER_HOME=path\to\Norconex\web\crawler\folder\
set TEST_DIR=path\to\prometheus\test\folder

java -javaagent:%TEST_DIR%\jmx_prometheus_javaagent-0.18.0.jar=9123:%TEST_DIR%\jmx_config.yaml ^
     -DenableJMX=true ^
     -Dlog4j2.configurationFile="%CRAWLER_HOME%\log4j2.xml" ^
     -Dfile.encoding=UTF8 ^ -Dworkdir="%TEST_DIR%\workdirs" ^
     -cp "%CRAWLER_HOME%\lib\*" ^
     com.norconex.collector.http.HttpCollector start -clean -config=%TEST_DIR%\crawler_config.xml
Notice that a port is specified in the command. The port corresponds to the one set in the prometheus_config.yaml: scrape_config section. You can define more than one job at a time using the same hostname and a different port number for each job.
Run the run-job.bat file to start the crawler.
After starting the crawler, you will see logs being written to the console. You can now switch over to your Prometheus Dashboard and try one of the following queries:
- {job=”collector-http”}
- {job=”collector-http”, key=~”DOCUMENT_QUEUED|DOCUMENT_COMMITTED.*”}
- {job=”collector-http”, key=~”DOCUMENT_FETCHED|DOCUMENT_COMMITTED.*”}
- {job=”collector-http”, key=~”DOCUMENT_QUEUED|DOCUMENT_FETCHED|DOCUMENT_COMMITTED.*”}
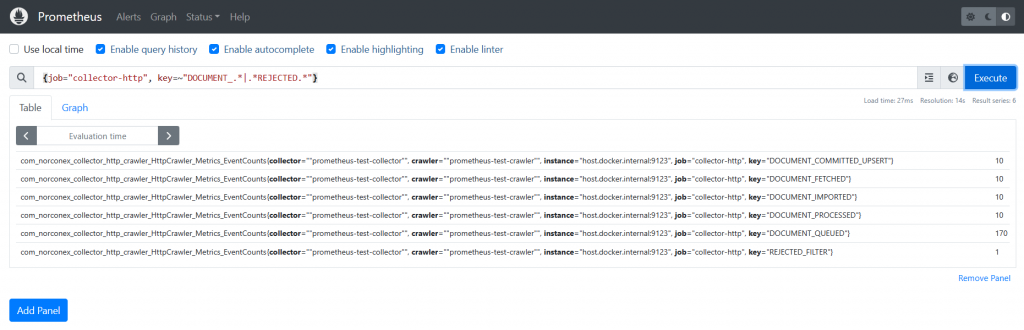
- {job=”collector-http”, key=~”DOCUMENT_.*|.*REJECTED.*”}
These queries would return the number of documents queued, fetched, and committed. Plus, the query results will show you the number of rejected documents. The job name refers to the job defined in the prometheus_config.yaml file: scrape_config section. The key in each query corresponds to an event type gathered by the crawler, importer, committer, and collector core. By specifying different events in the key, you can view the information you’re interested in regarding a specific crawling job.
You have abundant options for what events you include in your search. Here are some common ones:
- DOCUMENT_COMMITTED_DELETE
- DOCUMENT_COMMITTED_UPSERT
- DOCUMENT_FETCHED
- DOCUMENT_QUEUED
- DOCUMENT_PROCESSED
- REJECTED_UNMODIFIED
- REJECTED_DUPLICATE
- REJECTED_BAD_STATUS
As you enter the query in the search box, the result will be displayed almost instantly. You can then view it in either Table or Graph format.
Table Format:
Graph Format:
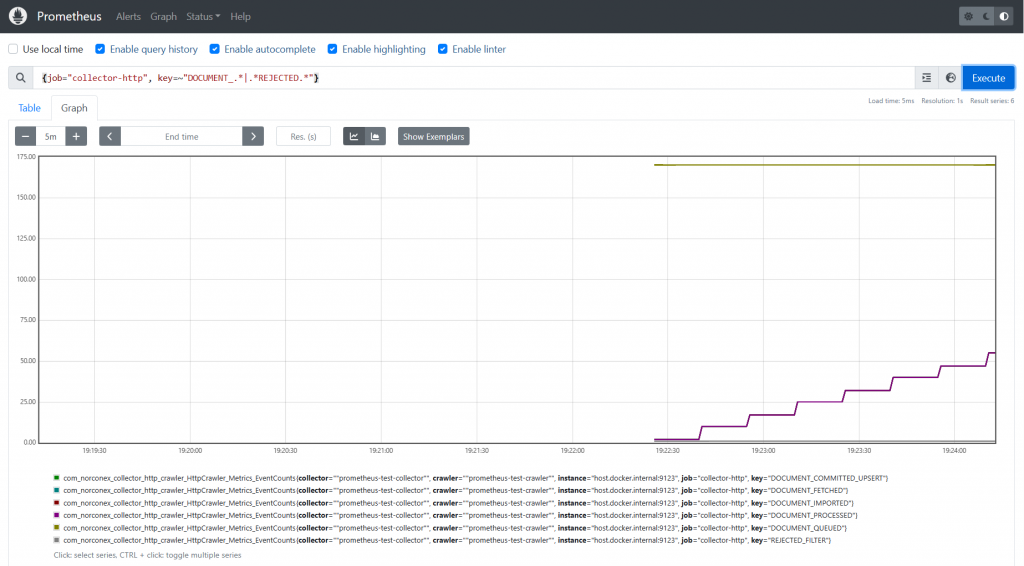
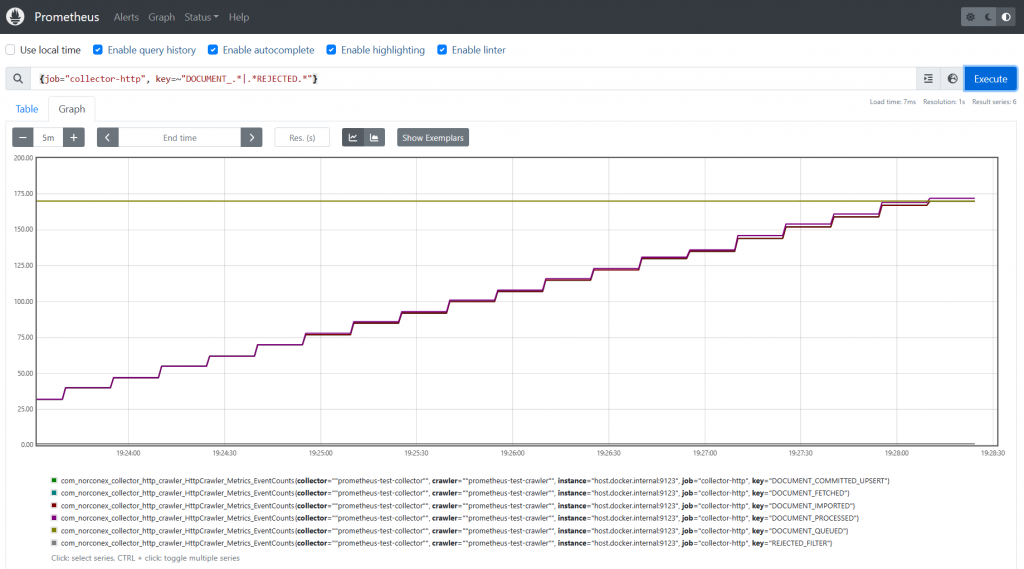
The graph generated by Prometheus offers a visual depiction of the crawling job’s advancement. As shown in the above graph, the golden line represents the number of documents queued, while the purple line depicts the number of processed documents. Eventually, these two lines will intersect after all documents have been processed, as demonstrated below. This depiction allows you to quickly assess the progress of the crawling job, without having to access and inspect the logs.
Conclusion
With Prometheus, monitoring the progress of single or multiple crawling jobs is no longer a hassle. There’s no need to open multiple consoles for each crawler to check the progress—Prometheus can take care of it all to give you an instant, at-a-glance visual. Just select the events you’re interested in, and then display them visually to save time on your daily monitoring task.
While your interest in events may vary, setting up this configuration requires less than an hour. We strongly recommend giving it a shot using our web or file system crawler. So go ahead and experiment with different combinations of events that align with your monitoring requirements and preferences.
Feel free to leave us feedback on what you think of our crawlers or what type of crawler monitoring you find the most useful. We’d love to hear your thoughts!